星载版教程(Satellite Tutorial)
这个简易教程是用来帮助用户快速了解易点处理ICESat-2数据的流程。在完成教程以后,你将掌握用易点对ICESat-2点云进行地面和冠层顶部光子提取。如果有问题和意见建议,请联系easypoint3d@126.com。
(This simple tutorial is designed to help users quickly understand the process of using Easypoint to process ICESat-2 data. After learning this tutorial, you will master using Easypoint to extract ground and Top of Canopy (TOC) photons from ICESat-2 point clouds. If you have any questions or suggestions, please contact easypoint3d@126.com. )
1 教程概述 (Tutorial Overview)
以下是教程中包括的课程概述 (Below is an overview of this tutorial)。
| 功能 | 描述 |
|---|---|
| 读入ICESat-2点云 (Read ICESat-2) |
打开ICESat-2 H5文件 (Open H5 file of ICESat-2) |
| 点云裁剪(可选) (Clipping (Optional)) |
对点云的兴趣区域进行裁剪,可减小后续处理计算量 (Clipping region of interest, reducing the computational load for subsequent processing.) |
| ALCSF光子分类 (ALCSF Classification) |
使用ALCSF算法探测ICESat-2数据中的地面光子和冠层顶部光子 (Extrect Ground and TOC photons by ALCSF) |
| 保存结果 (Save Result) |
保存H5文件中的附加信息和ALCSF分类结果 (Save additional information of H5 file and ALCSF result to txt/csv/las file) |
2 读入点云 (Read ICESat-2)
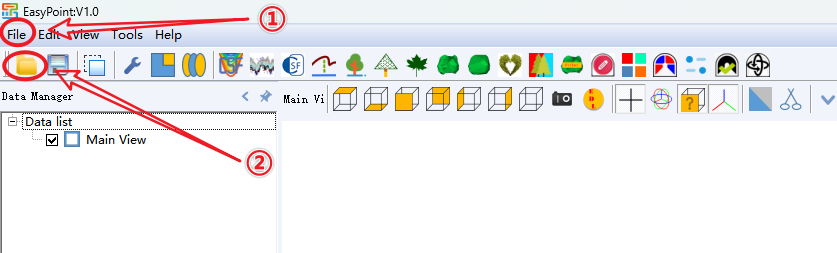
首先从NASA官网下载ICESat-2的ATL03和ATL08数据,并同时打开对应的两个h5文件。可以通过①文件菜单、②文件工具条2种方式实现。如下图所示:
(First, download the ATL03 and ATL08 data of ICESat-2 from the NASA website, and open the corresponding two h5 files simultaneously. This can be done in two ways: ① through the File menu, and ② through the File toolbar. As shown in the figure below:)
选择要打开的数据后,可根据①左/右或强/弱属性对波束进行筛选,并通过②选择要打开的具体波束。
(After selecting the data to be opened, you can filter the beams based on ① left/right or strong/weak attributes, and then ② select the specific beams to be opened.)
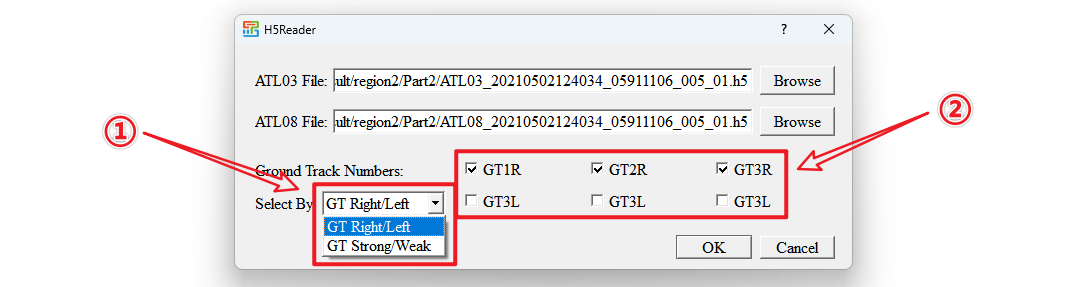
提示:请不要修改下载后的h5文件名。(Note: Please do not modify the names of the downloaded h5 files.)
点云如果没有颜色,可以通过点云属性调整点云赋色和点大小。以ATL08分类赋色为例,①在“Data Manager”中选择要赋色的点云;②在“Property Manager”中通过“Point Size”调整点大小;③在“Property Manager”中通过“Render scalar”选择渲染字段为“classification”;④此时点云颜色与ATL08分类结果对应 (0: 噪声;1:地面;2:冠层;3:冠层顶部) 。如下图所示:
(If the point cloud has no color, you can adjust the point cloud coloring and point size through the point cloud properties. For example, to color by ATL08 classification: ① Select the point cloud to be colored in the “Data Manager”; ② Adjust the point size in the “Property Manager” using “Point Size”; ③ Select the rendering field as “classification” under “Render scalar”; ④ The point cloud color will then correspond to the ATL08 classification results (0: noise; 1: ground; 2: canopy; 3: TOC). As shown in the figure below:)
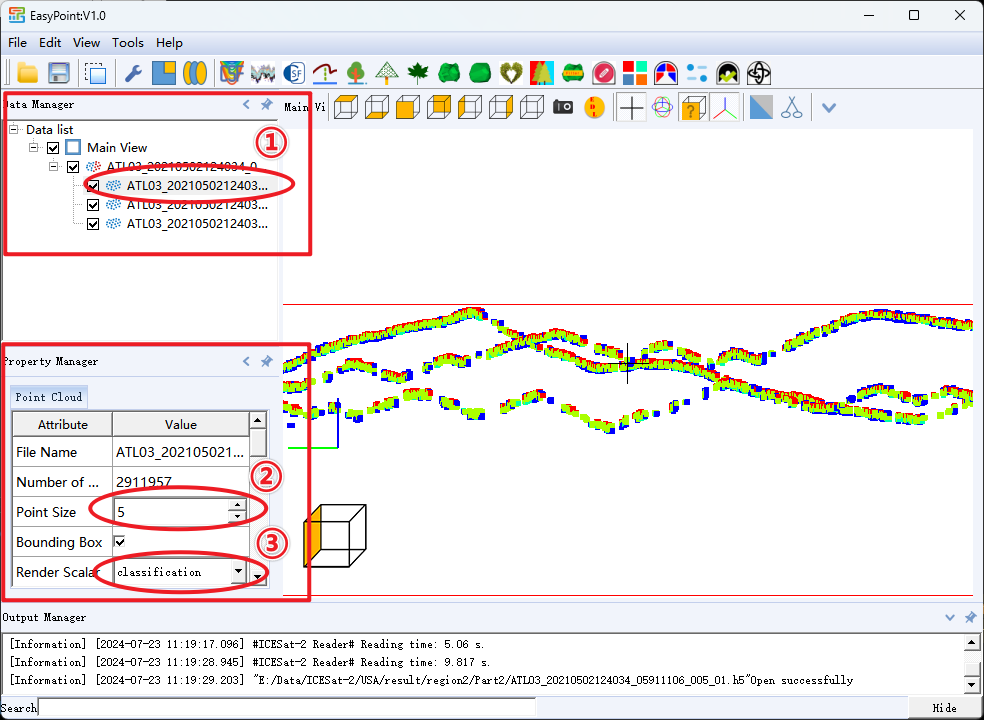
提示:显示坐标x轴为默认值,y轴为延轨距离,z轴为光子高程。(Note: The display coordinates are set as follows: x-axis is the default value, y-axis is along-track distance, and z-axis is photon height.)
3 点云裁剪(可选)(Point Cloud Clipping (Optional))
绘制兴趣区域裁剪 (Clip by the Drawn Area of Interest)
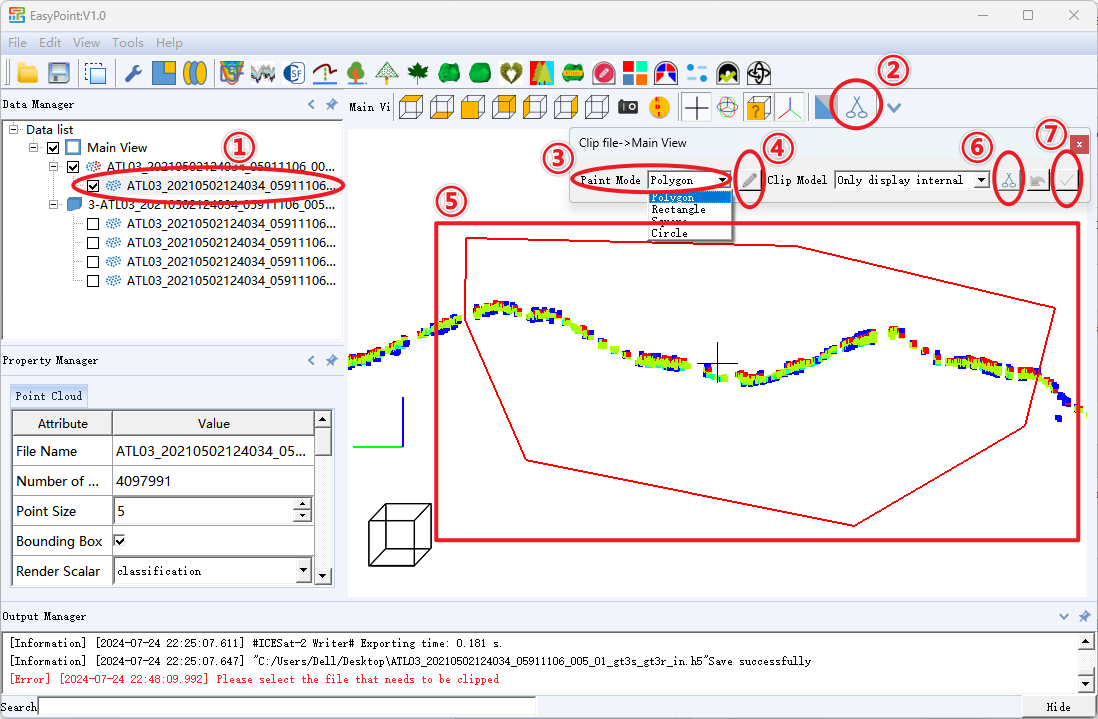
ICESat-2一轨数据往往覆盖数千公里范围,其中大部分数据可能不在兴趣区域内,对数据进行裁剪将有助于减下后续计算量。①选中要进行裁剪的数据;②点击工具栏中的“Clip Visible File”按钮;③选择兴趣区域的绘制模式(比如 “Polygon” );④点击“✏️”按钮来启动绘制;⑤在点云视图上绘制要截取的区域;⑥点击“✂️”按钮来预览裁剪结果;⑦点击“✔”按钮完成裁剪。
(A single ICESat-2 track often covers thousands of kilometers, and most of the data may not be within the area of interest. Clipping the data will help reduce the computational load for subsequent processing. ① Select the data to be clipped; ② Click the “Clip Visible File” button in the toolbar; ③ Choose the drawing mode for the area of interest (e.g., “Polygon”); ④ Click the “✏️” button to start drawing; ⑤ Draw the area to be clipped on the point cloud view; ⑥ Click the “✂️” button to preview the clipping results; ⑦ Click the “✔” button to complete the clipping. As shown in the figure below:)
按经纬度裁剪 (Clip by Latitude and Longitude)
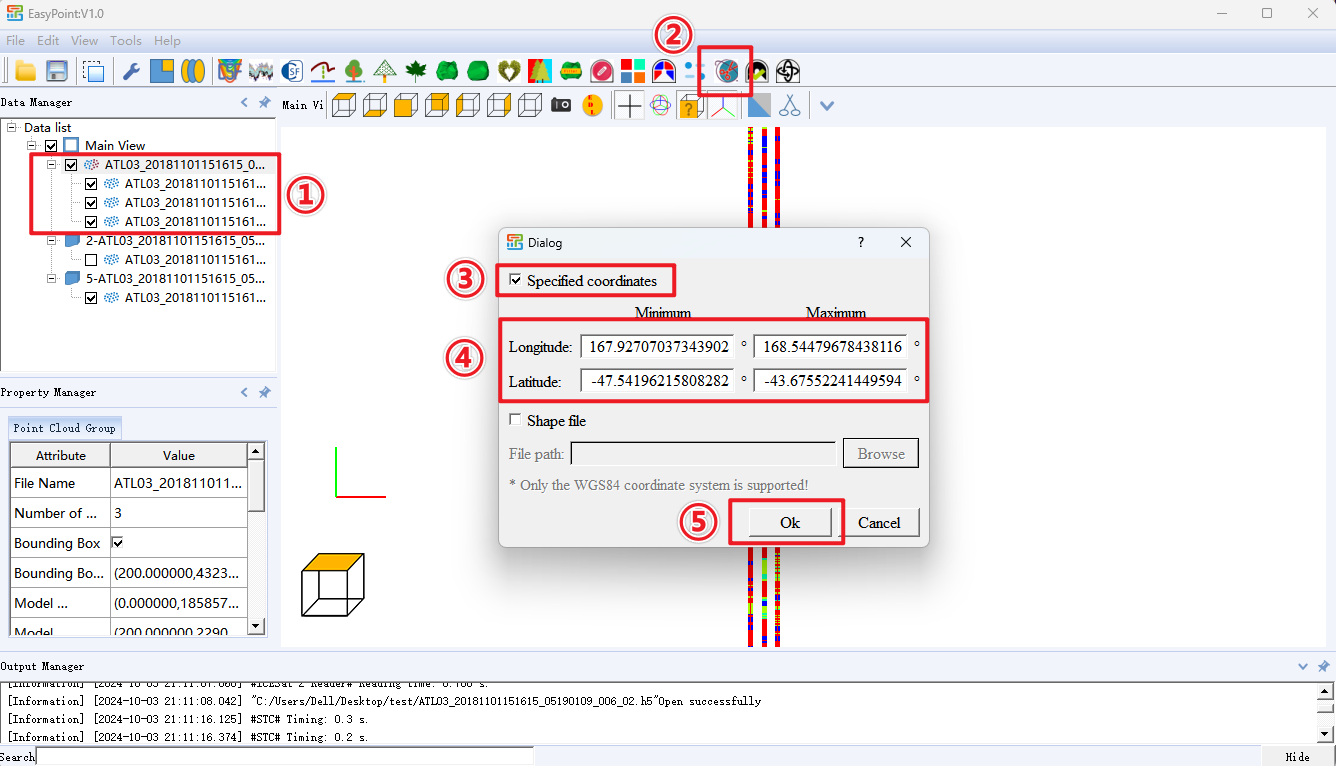
若需要更准确的定位兴趣区域,按经纬度裁剪将会是更佳选择。①在“Data Manager”中选择点云(可同时选中多轨数据);②在工具栏中选择“STC”按钮;③选择“Specified coordinates”方式;④输入兴趣区域的最小和最大经纬度坐标,默认数值为选中的所有数据的包围盒;⑤点击“OK”按钮等待裁剪完成。
(If more precise positioning of the area of interest is required, clipping by latitude and longitude will be a better choice. ①Select the point cloud in the “Data Manager” (multiple tracks of data can be selected at the same time); ②Click the “STC” button in the toolbar; ③Select the “Specified coordinates” method; ④Enter the minimum and maximum latitude and longitude coordinates of the area of interest. The default values are the bounding box of all selected data; ⑤Click the “OK” button and wait for the clipping to be completed.)
按研究区裁剪(Clip by AoI polygon file)
若兴趣区域为不规则形状,还可直接加载研究区的矢量文件进行裁剪。①在“Data Manager”中选择点云(可同时选中多轨数据);②在工具栏中选择“STC”按钮;③选择“Shape file”方式;④点击“Browse”按钮打开文件管理器;⑤选择兴趣区域的矢量文件,支持 **“kml”**和**“shp”** 两种格式;⑥点击“OK”按钮等待裁剪完成。
(If the area of interest is irregular in shape, you can also directly load the shape file of the study area for clipping. ① In the “Data Manager,” select the point cloud data (multiple tracks can be selected simultaneously); ② Choose the “STC” button from the toolbar; ③ Select the “Shape file” method; ④ Click the “Browse” button to open the file explorer; ⑤ Choose the vector file of the area of interest, which supports **“kml”** and **“shp”** formats; ⑥ Click the “OK” button and wait for the clipping process to be completed.)
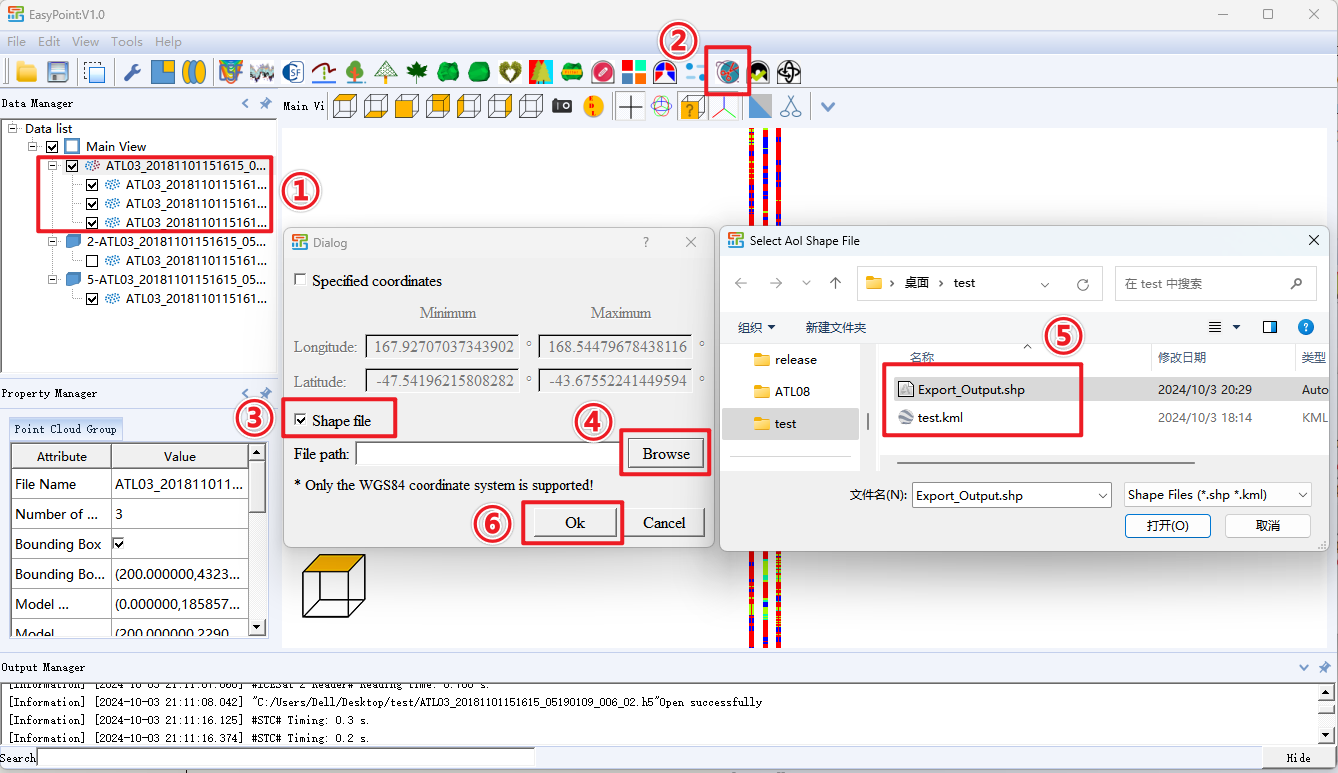
提示:当前版本需保证矢量文件坐标系为WGS84坐标系,坐标转换功能请期待后续版本。(Note: The current version requires that the shape file coordinate system be set to the WGS84 coordinate system; please look forward to future versions for the coordinate transformation feature.)
4 ALCSF光子分类 (ALCSF Classification)
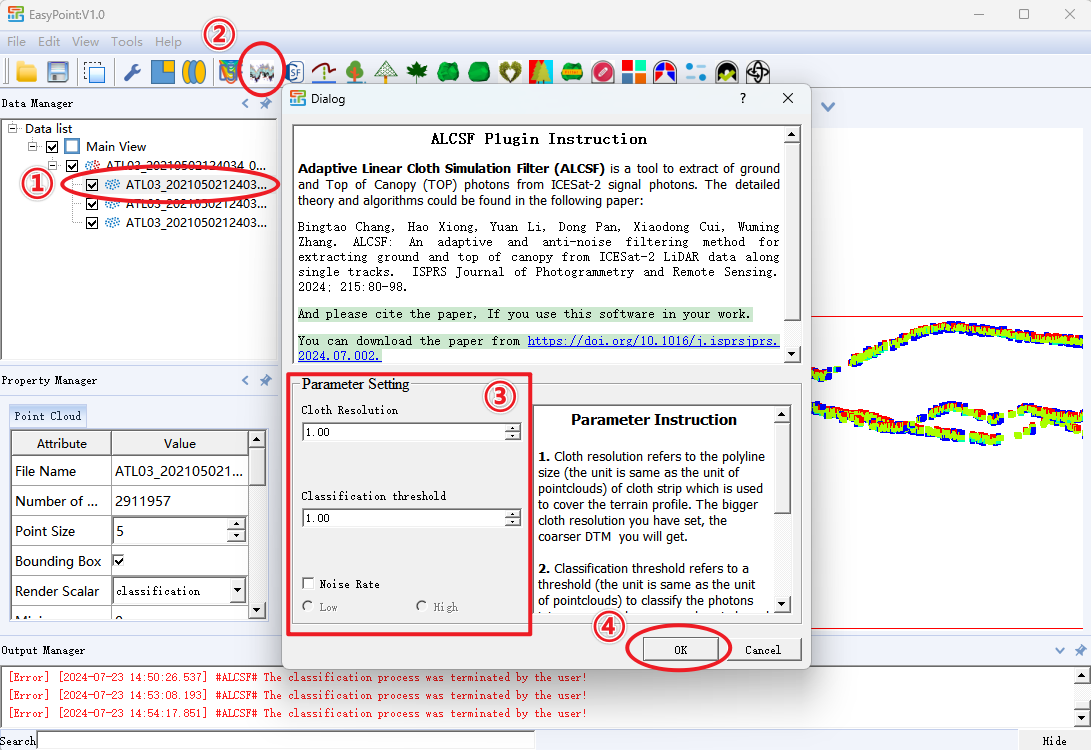
光子分类是为了将信号光子分类为地面、冠层顶部、冠层和噪声四类。①在“Data Manager”中选择点云;②在工具栏中选择“ALCSF”按钮;③(可选)在弹出的对话框中修改参数,默认参数能够适用于大部分场景,具体参数介绍请阅读“Parameter Instruction”。④点击“确定”按钮,弹出进度条开始执行ALCSF处理,处理完成后,弹出对话框选择是否新建视图来显示地面滤波结果,如果选择否则显示在原窗口中,选择是则会显示在新视图中,分类结果以“classification ALCSF”字段保存在新生成点云的属性中(数值与类别对应关系同上)。
(Photon classification is used to classify signal photons into four categories: ground, TOC, canopy, and noise. ① Select the point cloud in the “Data Manager”; ② Select the “ALCSF” button in the toolbar; ③(Optional )Modify the parameters in the pop-up dialog box. The default parameters are suitable for most scenarios. For detailed parameter descriptions, please read the “Parameter Instruction”. ④ Click the “OK” button to start the ALCSF process. A progress bar will appear. After processing is complete, a dialog box will appear asking whether to create a new view to display the classification results. If “No” is selected, the results will be displayed in the original window. If “Yes” is selected, the results will be displayed in a new view. The classification results are saved in the “classification ALCSF” field in the properties of the newly generated point cloud.)
5 保存结果 (Save Results)
上述处理过程中生成的点云保存在内存而非硬盘中,用户可以选择多种文件格式进行保存,如txt、csv、las。可以通过①选中要保存的文件;②在工具栏中选择“保存”按钮;③在弹出的“Save file”对话框中选择 “.h5” 保存类型;④选择文件夹和设置文件名并点击确定;⑤在弹出的“Export Setting”对话框中选择要导出的文件类型 (txt、csv、las) ;⑥选择要保存的信息;⑦点击“Ok”或“Apply all”按钮完成设置并执行导出操作(同时导出多个文件时请使用“Apply all”)。如下图所示:
(The point cloud generated during the above process is stored in memory rather than on the hard disk. Users can choose from various file formats for saving, such as txt, csv, and las. This can be done by ① selecting the file to be saved; ② selecting the “Save” button in the toolbar; ③ choosing the “.h5” save type in the pop-up “Save file” dialog box; ④ selecting the folder and setting the file name, then clicking OK; ⑤ choosing the file type (txt、csv、las) to export in the pop-up “Export Setting” dialog box; ⑥ selecting the information to be saved; ⑦ Click the “Ok” or “Apply all” button to complete the settings and execute the export operation (use “Apply all” when exporting multiple files simultaneously ). As shown in the figure below:)
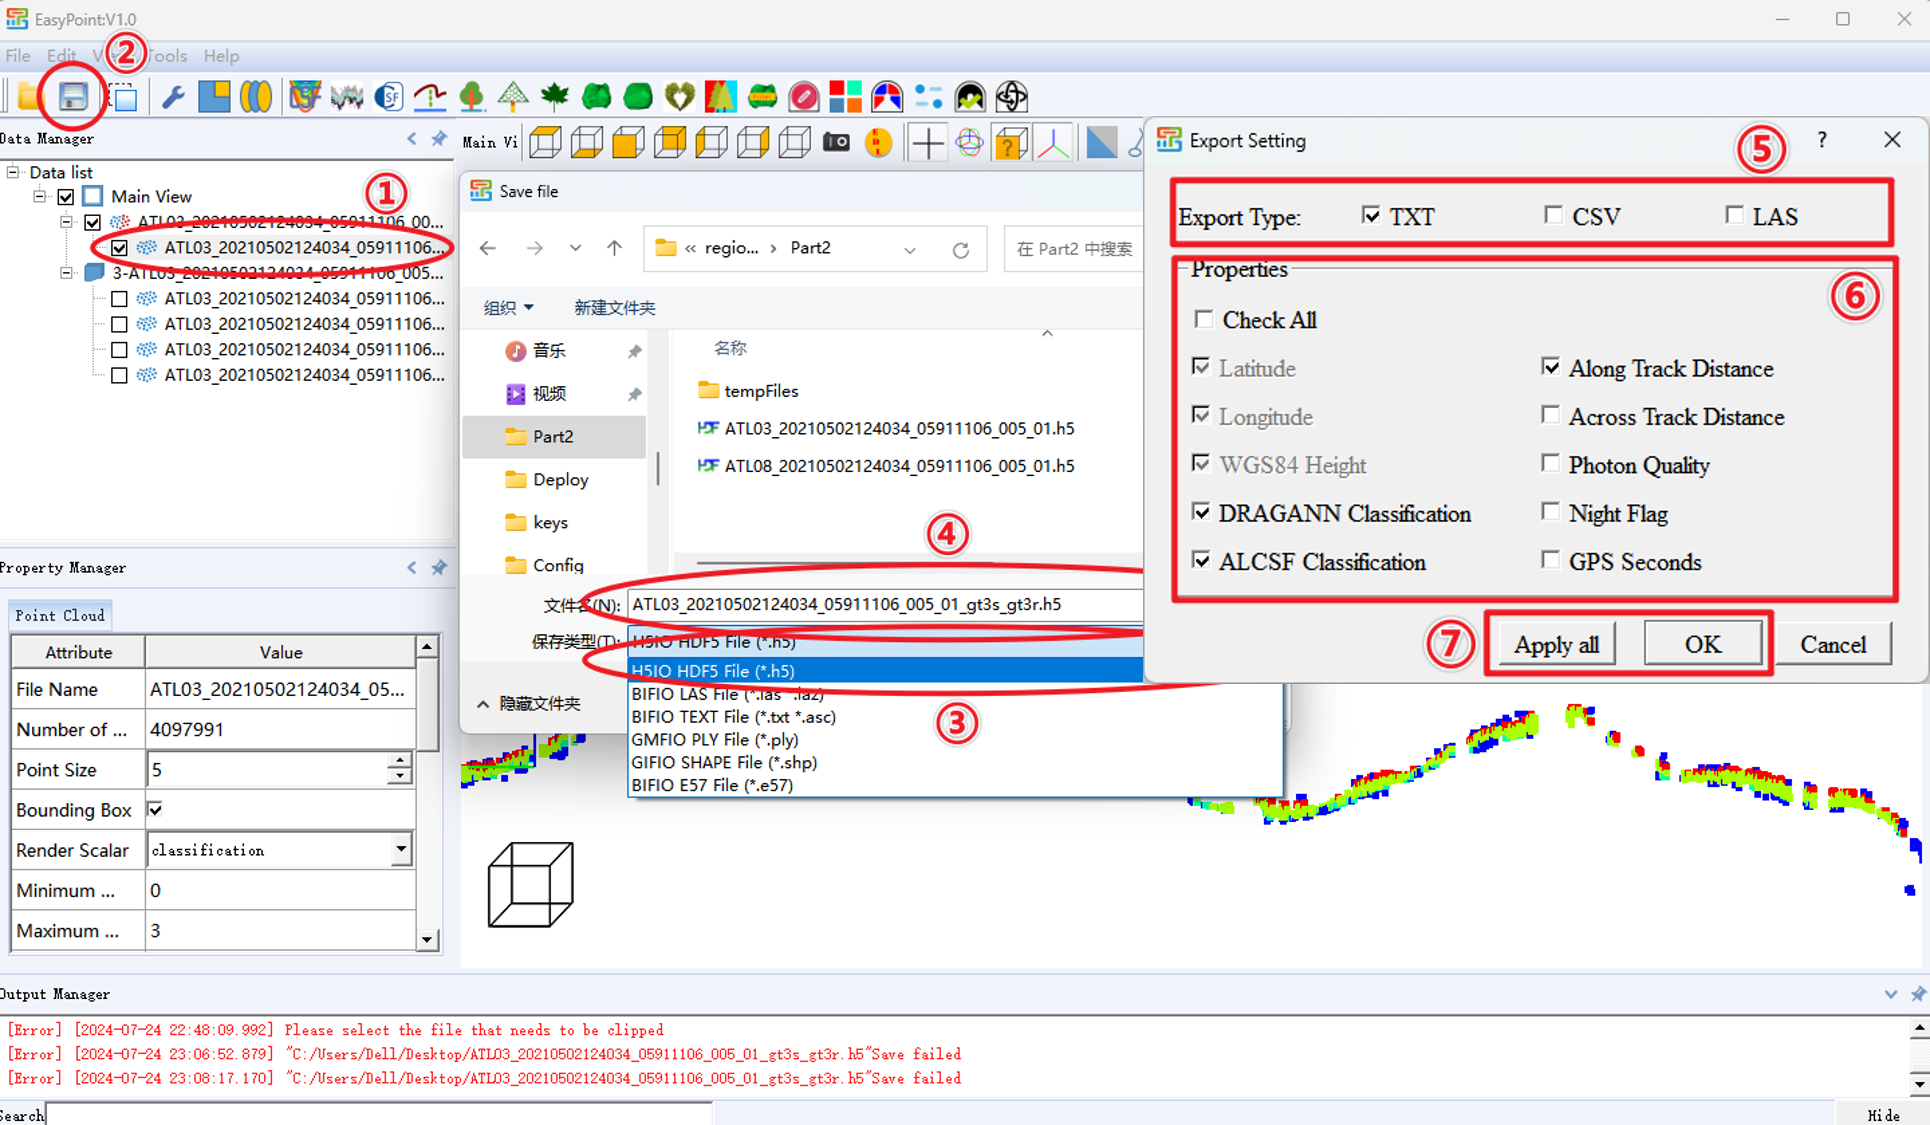
提示: 导出数据的xyz分别为经纬度和高程,与EasyPoint显示坐标不同. (Note: The exported data’s xyz coordinates correspond to longitude, latitude, and elevation, which differ from the display coordinates in EasyPoint.)